

WarViews with Google Earth
ETH Zurich doctoral student Nils B. Weidmann has made workdays easier for conflict researchers: thanks to his new WarViews tool, military conflicts can be visualized via Google Earth with a few mouse clicks.
One can have a thoroughly critical attitude to the virtual on-line globe Google Earth. After all, this freely accessible satellite image software provides insights into individual streets of houses and traffic systems that are sometimes so accurately detailed that the program regularly calls into action not only data protection professionals but even entire governments. Sensitive information has already been censored in a few countries for fear terrorists could use the tool to plan attacks.
Nevertheless, ETH Zurich researcher Nils B. Weidmann has now proved that Google Earth can also be used meaningfully in connection with military conflicts. The information scientist is a doctoral student with Lars-Erik Cederman at the Professorship for International Conflict Research, and developed the WarViews software together with Dresden cartographer Doreen Kuse. In fact software is really the wrong expression: WarViews is much more a data package that combines geographic and political science information and makes them easy to use via Google Earth. Weidmann has taken the raw data on military conflicts and deposits of oil, gas and precious stones available in different file formats and processed them so they are imported via a web server and displayed in Google Earth directly and automatically when the program is started.
Informative and user-friendly
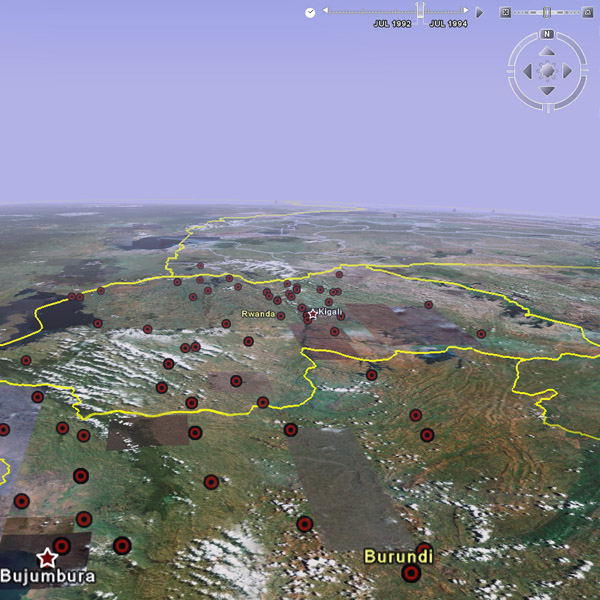
The background for his idea is the realisation that a strong correlation exists between violent conflicts and the respective geographic situation. This is why many conflict researchers include in their scientific analyses not only information about the space and time dimensions of military conflicts but also about the resources being fought over. However, in the past this caused them considerable additional effort. So-called geographic information systems (GIS) are available to analyse the data, but their use requires additional training. Nils B. Weidmann explains that “GI systems are confusing and difficult to handle, especially for someone who is not primarily concerned with computers and information science.” This is where WarViews now helps. For example, all that is necessary to retrieve the current areas of conflict in Rwanda is to download Weidmann’s data file in Google Earth format. Once that is done, just double-click and enter the target location into Google Earth, and after a short loading delay red dots appear all over the satellite image. Clicking on them displays more detailed information about the incident in question. The exact co-ordinates together with the date, time of day and names of the parties to the conflict are stated. Yellow and grey dots represent deposits of diamonds and precious stones, oil and gas fields are shown as green and red colons respectively, and pipelines are visible simply as lines in the same colours. In addition each of the various ethnic groups is represented by differently coloured polygons. The data originate from various sources, and the geographic data set about ethnic groups was prepared at the professorship itself.
Visualising processes
The greatest advantage of WarViews is that it allows not only current information to be retrieved. Google Earth provides a facility to incorporate a time axis. The young researcher says: “This is indispensable especially in conflict research, because it involves dynamic processes.” The data on violent clashes that he has used cover the years 1960 to 2004. Thus it is possible to follow the spread of military conflicts during more than 40 years by playing back the entire timeframe in Google Earth. However, the data cover only intra-state disputes, and only those involving at least two conflicting parties. For example it does not contain so-called “one-sided violence” – including for example an attack by a rebel group on a village. Nevertheless, WarViews enables researchers to obtain and visualise an overview of historic processes quickly. However, according to Weidmann, “Scientific analysis and statistical evaluation needs further special software.” Nonetheless, he says that there is great interest in WarViews, and not just for research purposes. For example the tool is already in use at the Norwegian University of Science and Technology in Trondheim in courses on conflict research.


READER COMMENTS